There's very little content either, it's literally a reformulation of the formula, no interesting graphs or geometric interpretation. What I expected from a title like "Linear Regression By Hand" was the minimization of some quadratic error function, by hand (i.e. using pencil and paper).
If you see all regression problems under the foil of maximum likelihood estimation, you might not know that ordinary least squares regression has a closed form solution
If you're interested in this you can read more in Mostly Harmless Econometrics [1] about adressing this with IV methods
[1] http://www.development.wne.uw.edu.pl/uploads/Main/recrut_eco...
[1] https://eli.thegreenplace.net/2014/derivation-of-the-normal-...
I almost certainly know something I'd consider "trivial" that you haven't encountered yet. I try to be really excited when that happens.
    SELECT
        @a_count := avg(count) as mean_count,
        @a_weeks := avg(`week`) as mean_weeks,
        @covariance := (sum(`week` * `count`) - sum(`week`) * sum(`count`) / count(`week`)) / count(`week`) as covariance,
        @stddev_count := stddev(`count`) as stddev_count,
        @stddev_week := stddev(`week`) as stddev_week,
        @r := @covariance / (@stddev_count * @stddev_week) as r,
        @slope := @r * @stddev_count / @stddev_week as slope,
        @y_int := @a_count - (@slope * @a_weeks) as y_int,
        @this_week_no := timestampdiff(WEEK, (select min(`date`) from dataset), curdate()) as this_week_no,
        @predicted := round(greatest(1, @y_int + (@slope * @this_week_no))) as predicted

    FROM (SELECT timestampdiff(WEEK, (select min(`date`) from dataset), `date`) as week, count(date) as count FROM dataset group by WEEK(date)) series;
This performs well enough to be able to crunch tens of millions of rows of data in "reasonable time" on a wimpy VPS.
The latter might be conceptually cleaner (though it's debatable, relational is a fairly nice programming model and a lot more consistent and well-founded than object orientation, for one), but it's seldom optimal.
Three orders of magnitude or more speedups are not unexpected by pushing the code to the data.
I share your doubt that this is worth it, to be clear.
http://www.statisticshowto.com/wp-content/uploads/2014/11/le...
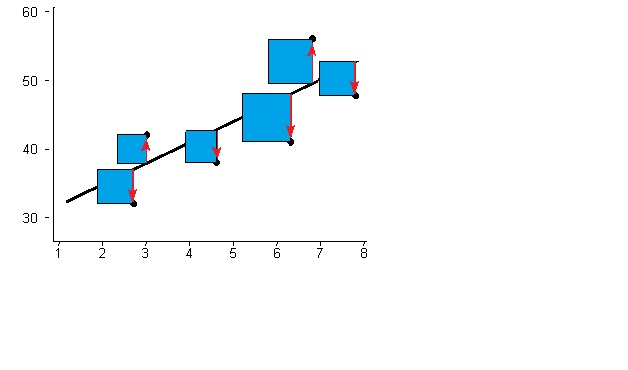
You need to square the values so that points that positives and negative differences (between the points and the trend regression line) don't cancel out.
Btw doing linear regression with pencil and paper just geometrically tracing a line that appears to fit the points and then calculating then coefficients is trivial.