The following blog-posts go in to more detail:
http://politicalcalculations.blogspot.ca/2013/12/the-major-t...
http://politicalcalculations.blogspot.ca/2013/12/the-widows-...
http://politicalcalculations.blogspot.ca/2013/12/the-men-who...
However, just looking at the time scale over which the net worth changes described in the original article occurred, and their magnitudes, it doesn't seem likely that the effect they describe can be explained so easily by social factors. Hypothesizing that it's just a social change related to shrinking households leads to some interesting questions about what that really means in practical terms: Did the bottom 5% go from an average net worth of -$9K to -27K over the course of a decade because, on average, three individuals in the red would get together to form a combined household with pooled debts? Did the 25th percentile go from an average of $10k to an average of $3k because of parents getting divorced and kids moving out en masse? Meanwhile wealthy people's family structures remain static.
I think the data you link and the data in the article are reconcilable. Income and wealth are different things, after all. Perhaps wealthier folks' net worth dropped less precipitously during the Great Recession because they experienced nothing worse than a drop in the valuation of their primary residence. Meanwhile less wealthy folks suffered a greater loss because they were more likely to get foreclosed on, therefore suffering a loss of all the equity they had built up in their homes. This trend wouldn't show up as much in the income numbers because losing your house doesn't necessarily coincide with losing your job, certainly not the way things were playing out in 2008.
1. If you own 10% equity in a home which declines in value 20%, you now have negative wealth. A 200% decline.
2. If you own 50% equity in a home which declines in value 20%, you have suffered a mere 40% decline.
However, household GINI is definitely the more relevant figure, as most big economic decisions (where to work, where to live) are made at the household level rather than at the individual level.
More concretely, if I divorce my wife and we become two households does that mean that US economic inequality has increased? I would say not, but the household GINI would say that it has.
Not relevant to the point OP made.
Whether or not it's "better," it still impacts the numbers.
I suspect a lot of people reading this board and living in Silicon Valley and other tech boom towns don't feel what that graph is saying in terms of day to day impact.
Perhaps, but there is no hard data at the individual level because, as it happens, basically every comprehensive dataset on income or wealth relies on tax or census data, which are aggregated at the household level by design. So any empirical claim about individual-level data should be taken ex ante with a big grain of salt and evaluated carefully; especially in a heavily politicized field like economics where data is scarce and motivated reasoning reigns.
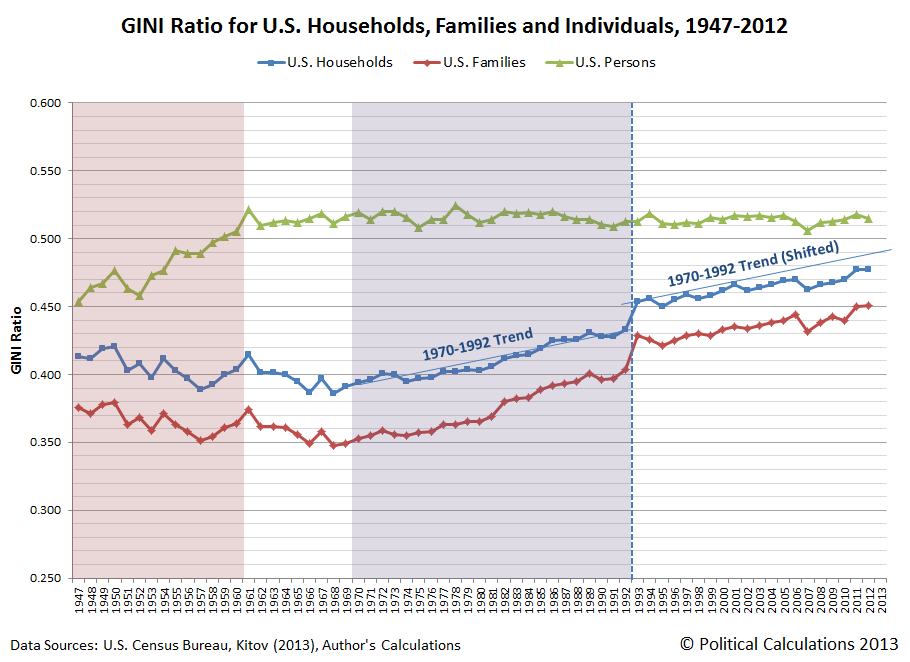
Take, for instance, the graph you cite [1], which cites Kitov and Kitov (2013) [2] along with the US census bureau as a source. The problem is, what that paper provides is not an empirical dataset but a microfounded model for predicting individual income --with all the problematic epistemological/overfitting caveats that they come with. Presenting that graph as an empirical fact and not as a debatable modeling exercise is quite misleading.
Besides, as others have pointed out, all the links you provide discuss income, not wealth (and no, their arguments/reasoning about income do not readily/trivially translate to wealth, as you commented below). If you are interested, check out the work of Cheryl Doss [3], who has conducted actual empirical work about the differences between household and individual equality in Ecuador, Ghana and India.
(PD: Oh wow even their claims about changing family structure in that blog [4] is disturbingly model-dependent. Much is made about the percentage of single-person households following an S-shaped curve, inflecting at 1968. However, they fit a sigmoid to what is a patently linear trend in the total number of single-person households beginning in 1950, and extrapolate back to 1900 despite having only two data points for that period. This wouldn't pass even a cursory peer-review, sorry.)
[1] http://1.bp.blogspot.com/-g3WZGpDibPM/Up3ZAPRtScI/AAAAAAAAJq...
[2] http://www.ecineq.org/ecineq_bari13/FILESxBari13/CR2/p177.pd...
[3] http://www.genderassetgap.org/sites/default/files/Doss%20-%2...
[4] http://politicalcalculations.blogspot.ca/2013/12/the-widows-...
The wealth of non rich Americans is almost entirely contained in their highly leveraged houses. If housing prices collapse, their wealth collapses.
In 2008, housing prices collapsed.
[1] http://1.bp.blogspot.com/-aGE47oMJAQw/UhZtjjtKorI/AAAAAAAAJz...
[2] http://www.pgpf.org/Chart-Archive/~/~/media/A130E85DDC064B81...
[3] http://www.frbsf.org/wp-content/blogs.dir/1/files/1106bb.gif
I'm not an economist, so these are speculative, but seem reasonable based on the fact that we're talking about loss of wealth from households below median:
Loss of life (specifically heads of household) due to the wars (I'm guessing most military households, being young and having maximum education of high school to "some college" will be below median)
Increased energy costs (gas being a marginal cost would hit people with less marginal income harder).
Loss of jobs to automation (I'm thinking secretaries, anything that can be replaced by an iphone, etc)
Declining birth rate (last I heard total high school graduations were supposed to peawould tend to lead to oversaturated teaching jobs, also relatively low-paying.
Chrysler was in distress long before the recession.
http://en.wikipedia.org/wiki/Income_inequality_in_the_United...
Consider, for example, that many people have negative wealth.
Also, whether or not something is depressing, surprising, or bad is entirely subjective. Something you do not consider surprising may in fact be surprising to another individual, so without knowing them it's sort of silly to say "it isn't surprising". If they say it is surprising, it means to them it was. If you do not think others should be surprised, it may be useful for you to explain what knowledge you have that prevented your being surprised.
I also like that the mean wealth in America is 6x the median wealth.
Actually, I find the numbers for the 75th+ percentiles a bit surprising, as my mental model had them with significant uptick after about 2011 or so. Kind of a wealth transfer from the lower percentiles. Whereas, this research seems to show that while erosions were smaller for the top (due to their non-real estate growth), no demographic they researched showed overall wealth growth from 2007 on. At best, they've gotten back to zero slope.
A lot of factors contribute but housing was one of the major factors. "Net worth" was/is tied directly to their home and the 2006/07 crash. With the government screwing with the markets and investors buying homes as rentals, we just might see another sharp decline shortly...
http://www.zerohedge.com/news/2014-06-24/americas-most-impor...
edit: What I'm saying is, America has a baby-boomer generation that is retiring in droves, more power to them but don't do a study at a major university sounding alarm bells unless an important factor like a massively retiring baby boomer generation is considered.
My wife in I, who recently finished professional schools, earn (combined) in the top 5%. But because of our student debt, when I do a "wealth" calculator, I'm apparently literally at the bottom of the wealth chart - 0%. Leads me to question:
1. Is College attendance increasing, or decreasing over time?
2. Is price of College attendance increasing, or decreasing over time?
I suspect both increasing. Would that explain some (or most, or all?) of this phenomenon? Average or lower income individuals will mostly go from positive to negative to put themselves through school, while rich or upper class will not. Would be interested how much of the phenomena that would explain.
[1] http://money.cnn.com/2014/06/11/news/economy/middle-class-we...