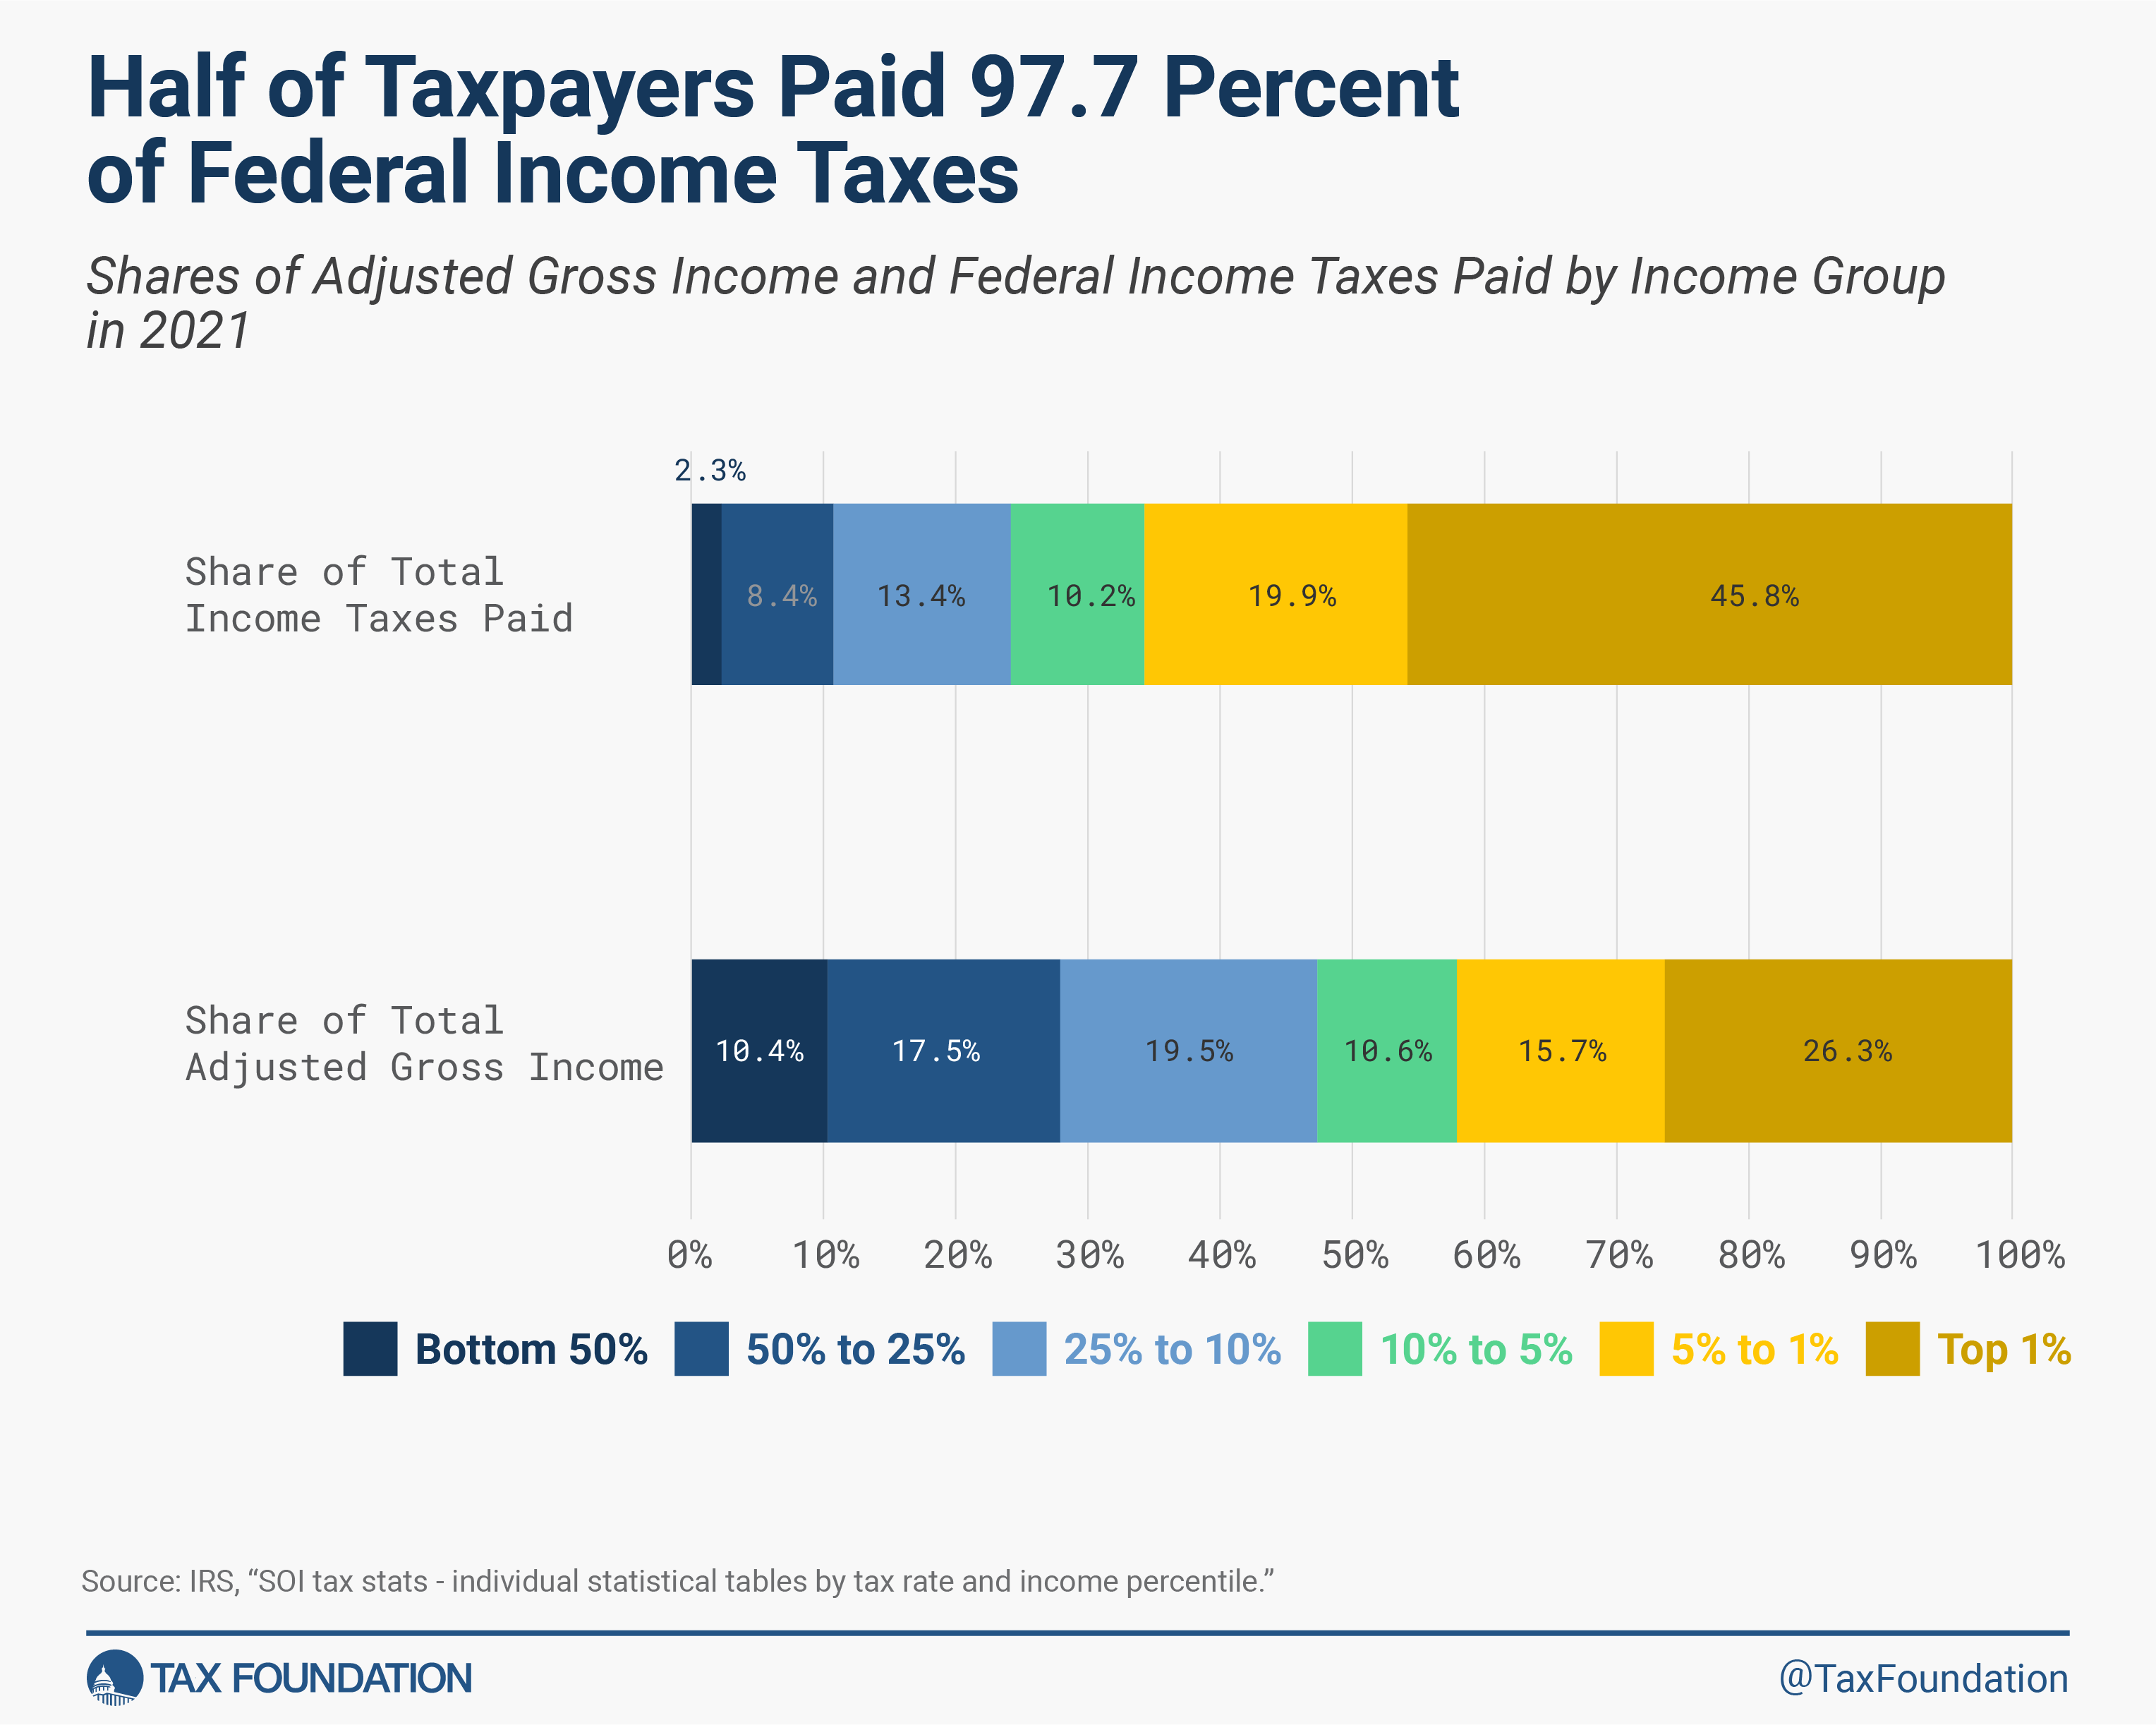
Top 1%: 40.4%
Top 5%: 61%
Top 10%: 72%
Top 25%: 87.2%
Top 50%: 97%
Bottom 50%: 3%
That hardly looks regressive. Is there some other standard by which you are judging whether tax policy is sufficiently graduated enough?
https://taxfoundation.org/data/all/federal/latest-federal-in...
https://www.forbes.com/sites/sarahhansen/2021/06/08/richest-...
the 25 richest Americans (by Forbes’ tally) paid a “true tax rate” of just 3.4% on wealth growth of $401 billion between 2014 and 2018.
I know you're making a good faith argument, but you're twisting the definition of regressive. For example, if a country has one citizen with an income of 1 trillion, and one hundred thousand citizens with an income of $10,000 each, the trillionaire would still pay over 99% of taxes even if taxes were proportional.
The point is that with severe income inequality, it is fair that the super rich pay a very, very high proportion of taxes. The 40.4% seems high for the "top 1%" of the population, but if you replace "top 1%" with their actual average income, the comparison is less misleading.
It is not a legit source for progressive tax policy.
The Congressional Budget Office has been the most reputable source for tax policy data. The current director was appointed by Trump 2019 and was retained through Biden's presidency.
The CBO is very wonky and so far as withstood partisan meddling by presidents.
https://taxfoundation.org/wp-content/uploads/2024/03/FedData...
(see the footnote)
Now let's see control of assets.
The national debt increased because we increased the amount of the federal government does, it the income tax.
More than 100% of the net improvement is from tech and medical R&D, not the bloated military-welfare apparatus.
In 1960 the top tax rate was 91%. In 1980 it was 70%. Reagan dropped it to 35% and it's stayed below 40% since. Then add in that corporations and the wealthy have moved away from having normal income that isn't taxed (loans backed by assets) and you've lost half the tax revenue that paid for cheap housing, nearly free healthcare and public college and you have a healthy society and middle class.
But then to screw the pooch even more, Bush printed 5 trillion for his wars and two tax cuts. Trump printed money for his tax cuts too. (these expenses were never in the annual budget - they just printed the money)
Tesla, one of the richest corporations in our country just reported 0% tax in three years.
Our national debt has nothing to do with the annual budget and expenses, including USAID and helping Ukraine.
It is 100% because of tax policy.
So what actually is driving the national debt higher? The never popular answer is entitlement spending (Social Security, Medicare, Medicaid) + interest, which is exasperated by an aging population. In fact, almost all future debt growth is driven by these programs. The rest of the budget is expected to balance out. Tax revenue is expected to increase, and discretionary spending is expected to fall as a % of GDP.
How many times does this need to be debunked?