When is a cpu core sending a message to another core?
If we have two of these processes, each on separate cores, and they occasionally need to talk to each other, then knowing the best choice of process/core location can keep the system operating in the lowest latency setup.
So, an app like this could be very helpful for determining where to place pinned processes onto specific cores.
There's also some common rules-of-thumb such as, don't put pinned processes that need to communicate on cores that are separated by the QPI, that just adds latency. Make sure if you're communicating with a NIC to find out which socket has the shortest path on the PCI bus to that NIC and other fun stuff. I never even thought about NUMA until I started to work with folks in HFT. It really makes you dig into the internals of the hardware to squeeze the most out of it.
I think of NUMA nodes as multiple computers which just happen to share a common operating system.
A Primer on Memory Consistency and Cache Coherence, Second Edition
https://www.morganclaypool.com/doi/10.2200/S00962ED2V01Y2019...
(free online book) would help
Cross-cache communication may simply happen by reading or writing to memory touched by another thread that most recently ran on another core
Check out https://en.wikipedia.org/wiki/MOESI_protocol for starters, although I think modern CPUs implement protocols more advanced than this (I think MOESI is decades old at this point)
A CPU will normally translate atomic instructions like "store this 32-bit value to this address" into special messages on the memory bus. Atomic operations it turns out are already normally implemented in the message protocol between cores and memory fabric, so you just translate the atomic instructions into atomic messages "for free" and let the controller sort it out. But the rules of how instructions flow across the memory bus is complicated because the topology of modern CPUs is complicated. They are divided, partitioned into NUMA domains, have various caches that are shared or not shared between 1-2-or-4-way clusters, et cetera. They must still obey the memory consistency rules defined by the platform, and all the caches and interconnects between them. As a result, there isn't necessarily a uniform measurement of time for any particular write to location X from a core to be visible to another core when it reads X; you have to measure it to see how the system responds, which might include expensive operations like flushing the cache. It turns out two cores that are very far away will just take more time to see a message, since the bus path will likely be longer -- the latency will be higher for a core-to-core memory write where the write will be visible consistently.
So when you're designing high performance algorithms and systems, you want to keep the CPU topology and memory hierarchy in mind. That's the most important takeaway. From that standpoint, these heatmaps are simply useful ways of characterizing the baseline performance of some basic operations between CPUs, so you might get an idea of how topology affects memory latency.
I find it pretty interesting where the interface that cpu makers present (eg a bunch of equal cores) breaks down.
So when you switch to mesh buses the interconnect takes up way more space. So one has to compromise between bus width and the amount of area one is using for the interconnects. Typically this means running reduced width buses around the mesh which limits core to core bandwidth. Not so much a big deal if you're running a server, more a problem though if you're trying to run interactively with a user. Unless of course you're Apple and just devote a truckload of die space to dump a fucking mammoth amount of interconnect between your dies.
There's also ancillary concerns as well like fabrication yield. For instance AMD runs chiplets probably because they can mix and match yields and they naturally segment the market. Get a CCX with 3 working cores? Pair it with another and you have a 6C/12T CPU. Get a CCX with 2 working cores? Pair it with another and you get a 4C/8T. Intel either gets a working die or they don't.
The problem here is the interconnect between the CCXs is relatively slow. Dog slow compared to the ring bus. Even running the Infinity Fabric's fclock at 1.8GHz only nets you 57.6GB/sec between CCXs and five times the latency of the ring bus. When you look at a Ryzen 3300 (2x2 CCX) and a Ryzen 3300X (1x4 CCX) the difference in performance is non-trivial and that's the Infinity Fabric dragging performance down. In comparison an Intel core's L3 cache on a 3GHz ring bus (i.e. non-turbo) pulls down at 96GB/sec. Sure you're still ultimately limited by DRAM but if stuff is staying in LLC it's a hell of a performance boost. In Zen 3 AMD even went to 8 core CCXs which gave the whole thing a huge performance boost. Part of that was because the smaller lithography gave them more area to play with so they could fit everything plus the interconnects onto the chiplet size they needed.
So yeah, I hope that little greatly oversimplified, surface level look was helpful.
I had no idea that there were 2x2 and 1x4 chips. Do you have a link that compares those in performance?
But TL;DR modern big processors are not one big piece of silicon but basically "SMP in a box", a bunch of smaller chiplets interconnected with eachother. That helps with yield ("bad" chiplet costs you just 8 cores, not whole 16/24/48/64 core chip). Those also usually come with their own memory controllers.
And so you basically have NUMA on a single processor with all of the optimization challenges for it
From my 12900ks (its a boosted 12900k) Core 6-7 is rated for 5.5ghz.
Freq MHz DTS C VID mv PC Eff Fr UCcode 0x1f VR Volt Limit 2500 ---------------------------------------------------- 800 24 1307 52 517 Uncore 3600 IA AC LL 0.5999 800 20 1282 52 47 Power 23.465 IA DC LL 1.0996 800 20 1314 52 70 Current Limit 0.0000 SA AC LL 0.0000 800 20 1308 52 69 iccmax 1023 SA DC LL 0.0000 800 20 1303 52 88 PL1 32760 iccmax dis True 800 18 1293 52 69 PL2 32760 TAU 33 800 20 1286 55 39 Memory 5200 PPP_OVR True 800 22 730 55 37 EE_Turbo_Dis True RTH_Dis True 800 22 1377 40 60 Dis_Ring_EE False HWGuidedSch True 800 22 1172 40 73 IA_CEP_Dis True Dynamic_Mem True Full_Range_Multi False SA_Freq_OVR False TSC_Dis_HW False Banding_Ratio 0 PVD_Ratio_thresh 0 SA_CEP_Dis True FLL OC Mode 3
---------------------------------------------------------------------------------------------------------------------------------
Core Voltage Adapt 0 Ring Voltage Adapt 0 Core PLL V 900 Core Voltage Offset 0 Ring Voltage Offset 0 Ring PLL V 900 L2 Voltage Adapt 0 L2 Voltage Offset 0 AVX512 Offset 0 SA Voltage Offset 0 Ring VID 0 MC PLL V 900 AVX Offset 0 AVX2 V Guardband 0 AVX512 V Guardband 0 SA Voltage Manual 1150
---------------------------------------------------------------------------------------------------------------------------------
Turbo Ratio Limit 55, 55, 52, 52, 52, 52, 52, 52 Core OCMB Max Ratio 0 Ring Min Ratio 8 Turbo Limit Cores 1, 2, 3, 4, 5, 6, 7, 8 Ring OCMB Max Ratio 0 Ring Max Ratio 47 Atom Ratio Limit 40, 40, 40, 40, 40, 40, 40, 40 Atom Limit Cores 255, 255, 255, 255, 255, 255, 255, 255Atom OCMB Max Ratio 0 OS Max Ratio 34 HWP Min Ratio 43 HWP Max Ratio 255 Max Possible Core 40 Max Possible Ring 47 UCLK 2600
Num cores: 24 Using RDTSC to measure time: false Num round trips per samples: 5000 Num samples: 300 Showing latency=round-trip-time/2 in nanoseconds:
       0       1       2       3       4       5       6       7       8       9      10      11      12      13      14      15      16      17      18      19      20      21      22      23
  0
  1    0±0
  2   37±6    36±6
  3   31±6    37±6     5±5
  4   26±6    26±6    26±6    26±6
  5   26±6    31±6    26±6    31±6     5±5
  6   31±6    31±6    36±6    31±6    26±6    21±6
  7   31±6    31±6    31±6    31±6    26±6    26±6     5±5
  8   31±6    31±6    31±6    31±6    26±6    26±6    31±6    26±6
  9   36±6    31±6    31±6    31±6    26±6    26±6    26±6    26±6     5±5
 10   31±6    36±6    31±6    26±6    26±6    21±6    26±6    31±6    26±6    31±6
 11   31±6    36±6    31±6    36±6    26±6    26±6    31±6    31±6    36±6    31±6     5±5
 12   31±6    36±6    31±6    42±6    26±6    31±6    31±6    37±6    31±6    37±6    31±6    36±6
 13   36±6    37±6    42±6    36±6    26±6    26±6    31±6    31±6    31±6    31±6    31±6    31±6     5±5
 14   31±6    36±6    37±6    36±6    31±6    26±6    36±6    31±6    36±6    31±6    36±6    31±6    31±6    36±6
 15   31±6    31±6    31±6    31±6    26±6    26±6    36±6    31±6    31±6    31±6    31±6    31±6    31±6    31±6     0±0
 16   42±6    42±6    42±6    42±6    31±6    31±6    37±6    36±6    36±6    42±6    37±6    36±6    36±6    36±6    37±6    37±6
 17   42±6    42±6    36±6    42±6    31±6    36±6    37±6    36±6    36±6    37±6    36±6    37±6    36±6    36±6    36±6    37±6    47±6
 18   42±6    42±6    42±6    42±6    31±6    31±6    37±6    36±6    37±6    36±6    42±6    36±6    37±6    36±6    36±6    36±6    47±6    52±6
 19   42±6    42±6    42±6    37±6    31±6    31±6    36±6    37±6    36±6    36±6    37±6    37±6    36±6    36±6    42±6    37±6    52±6    47±6    47±6
 20   42±6    42±6    42±6    36±6    37±6    31±6    37±6    36±6    37±6    36±6    36±6    42±6    37±6    36±6    36±6    42±6    42±6    42±6    42±6    42±6
 21   42±6    37±6    42±6    42±6    31±6    31±6    37±6    36±6    42±6    36±6    37±6    36±6    37±6    37±6    36±6    36±6    42±6    42±6    42±6    42±6    47±6
 22   42±6    42±6    42±6    36±6    36±6    31±6    36±6    37±6    36±6    37±6    36±6    36±6    36±6    37±6    36±6    42±6    42±6    42±6    42±6    42±6    47±6    52±6
 23   36±6    42±6    42±6    42±6    31±6    31±6    37±6    36±6    37±6    42±6    36±6    36±6    37±6    42±6    36±6    36±6    42±6    42±6    42±6    42±6    52±6    47±6    47±6
Possibility related to what fab generation the CPU is on vs. other chips tested?
EDIT: why the downvotes?
I can offer the following in return: https://i.pinimg.com/736x/cc/aa/30/ccaa3008f98375c26a221c85d...
Min: 48.3 Max: 175.0 Mean: 133.0
I’ll try to copy the exact results once I have a browser on Asahi, but the general pattern is most pairs have >150ns and a few (0-1; 2-3,4,5; 3-4,5; 4-5; 6-7,8,9; 7-8,9; 8-9) are faster at about 50ns.
Edit: The results from c2clat (a little slower, but the format is nicer) are below.
CPU 0 1 2 3 4 5 6 7 8 9
   0    0   59  231  205  206  206  208  219  210  210

   1   59    0  205  215  207  207  209  209  210  210

   2  231  205    0   40   42   43  180  222  224  213

   3  205  215   40    0   43   43  212  222  213  213

   4  206  207   42   43    0   44  182  227  217  217

   5  206  207   43   43   44    0  215  215  217  217

   6  208  209  180  212  182  215    0   40   43   45

   7  219  209  222  222  227  215   40    0   43   43

   8  210  210  224  213  217  217   43   43    0   44

9 210 210 213 213 217 217 45 43 44 0min/max/mean - 34.6ns/57.7ns/39.1ns
       0       1       2       3       4       5       6       7
  0
  1   58±6
  2   48±6    46±6
  3   39±6    37±6    36±6
  4   41±6    38±6    42±6    38±6
  5   35±6    37±6    37±6    36±6    36±6
  6   38±6    39±6    36±6    40±6    40±6    38±6
7 39±6 38±6 36±6 37±6 38±6 36±6 38±6I think there's a CLI tool for pastebin
       0       1       2       3       4       5       6       7
  0
  1   46±4
  2   37±4    34±4
  3   37±3    38±4    38±3
  4   34±4    34±4    34±4    37±4
  5   37±4    37±4    37±4    34±4    34±4
  6   38±4    34±4    37±4    34±4    34±4    37±4
7 37±4 34±4 37±4 37±4 38±4 37±4 34±4* which in hindsight sounds like TurboBoost was enabled, but I vaguely remember it being disabled in tests
No, they were already pinning to cores. Kernel was also in low-latency mode.
The project they handed to me was just the data plane, written in Rust. They also gave me a partial reference implementation of the control plane, meant for research purposes rather than performance. I had to add a lot of missing features to get it up to par with the supposedly industry-standard benchmark, which didn't exactly match spec so I had to reverse-engineer. Then I had to mate it with the data plane. (They originally suggested I build a control plane from scratch in Rust, but the lack of an ASN1 codegen lib for it made this infeasible within the time I had, considering also that I had 0 systems experience or familiarity with the protocols.) I don't remember all the optimizations, but the ones that still come to mind:
1. Fixing all their memory leaks, obviously. Kinda hard cause they were in C code auto-generated by a Python script. There was even a code comment // TODO free memory after use.
2. Improving the ASN1 en/decoding to take advantage of memcpy in some places. This is because asn1 has different alignment modes, some byte-aligned and some bit-aligned. The control plane used byte-aligned, but the standard ASN1.c lib understandably assumed bit-aligned in either case for simplicity's sake since it worked either way. So I added an optimized path for byte-aligned that used memcpy instead of inspecting each byte for the end markers. This was in a tight loop and made the biggest difference; basically every string copy got faster. The relevant function even knew it was in byte-aligned mode, so it was a simple fix once I figured it out; I tried to make a PR to improve this for everyone else, but forget why I couldn't.
3. Playing with different arrangements of passing messages between threads and different ways of locking. I forget all the ones we tried. Using "parking lot" locks instead of the default ones in the Rust portion helped, also more optimistic locks in other places instead of mutexes, I forget where and why. Since then I've come across the general concept of optimistic vs pessimistic locking a lot as something that makes or breaks performance, particularly in systems that handle money.
4. As I said, playing with the number of threads for each different setup in #3.
5. Playing with NIC settings. We were using Intel's DPDK library and optimized NIC drivers.
6. Making a custom `malloc` implementation that used a memory pool, was thread-scoped, and was optimized for repeated small allocs/deallocs specifically for a portion of the reused code that had a weird and inefficient pattern of memory access. I got it to be faster than the built-in malloc, BUT it was still break-even with DPDK's custom pooled malloc, so I gave up.
7. Branch hints. Tbh didn't make a big difference, even though this was pre Meltdown/Spectre.
8. Simplifying the telemetry. Idk if this helped performance, more of a rant... It's good enough to have some counters that you printf every 60s or something, then parse the logs with a Python script. That's very non-prone to bugs, anyone can understand it, and you can easily tell there's no significant impact on performance. It's overkill in this case to have a protobuf/HTTP client sending metrics to a custom sidecar process, complicating your builds, possibly impacting performance, and leaving no simple paper trail from each test. I respected the previous guy's engineering skills more than my own, but once I found a bug in that code, I took it out.
It looks kinda like the color scales are normalized to just-this-CPU's latency? It would be neater if the scale represented the same values among CPUs. Or rather, it would be neat if there were an additional view for this data that could make it easier to compare among them.
I think the differences are really interesting to consider. What if the scheduler could consider these designs when weighing how to schedule each task? Either statically or somehow empirically? I think I've seen sysfs info that describes the cache hierarchies, so maybe some of this info is available already. That nest [1] scheduler was recently shared on HN, I suppose it may be taking advantage of some of these properties.
You can definitely do things like that, including pinning an application to a certain set of cores for performance. When you have NUMA it's pretty much mandatory for low latency applications, since each CPU gets its own memory slots, significantly lowering latency cost. It's physically closer, for one.
It gets really fun when you get into network traffic, since you can bind a NIC to specific cores alongside kernel bypass stuffs and interrupt handling. Sometimes it even makes sense to have one NIC per CPU!
It's a lot of setup work though. Have a look into CPU shielding as well. The Linux scheduler cares more about fairness than it does latency, so you have to be very intentional in your setup.
Maybe consider including a MIT license in the repository.
Legally, that's a bit more sane than having a line in the readme.
In practice, github will recognize your license file and show the license in the indexes an d in the right column of your repository's main page.
    Num cores: 8
    Using RDTSC to measure time: true
    Num round trips per samples: 5000
    Num samples: 300
    Showing latency=round-trip-time/2 in nanoseconds:

       0       1       2       3       4       5       6       7
  0
  1   70±1
  2   53±1    42±0
  3   73±5   134±5    80±1
  4   16±0    49±1    56±1    46±1
  5   63±4    28±1   128±5    67±1    66±1
  6   56±1    49±1    10±0    81±4   124±4    72±1
  7   57±1    57±1    45±1    10±0    63±4   130±5    87±1

    Min  latency: 10.1ns ±0.2 cores: (6,2)
    Max  latency: 134.1ns ±5.3 cores: (3,1)
Mean latency: 64.7nsIf that's the case, I think it kicks in quickly because running this with 500, 5_000 and 50_000 round trips gives results in the same ballpark.
There doesn't seem to be any difference between performance and powersave governors for this particular test.
https://gist.github.com/smarkwell/d72deee656341d53dff469df2b...
If I crank up the amount of traffic going through the sockets, the average latency drops, presumably due to the processes being able to batch together multiple packets rather than having to block on each one.
I haven’t measured myself, but other people did, and they found the latency of message queues is substantially lower: https://github.com/goldsborough/ipc-bench
I looked at the sources. The pipe and fifo benchmarks also send a signal on every message, so they're not measuring what you'd expect.
Would two cores reading and writing to the same memory have this contention?
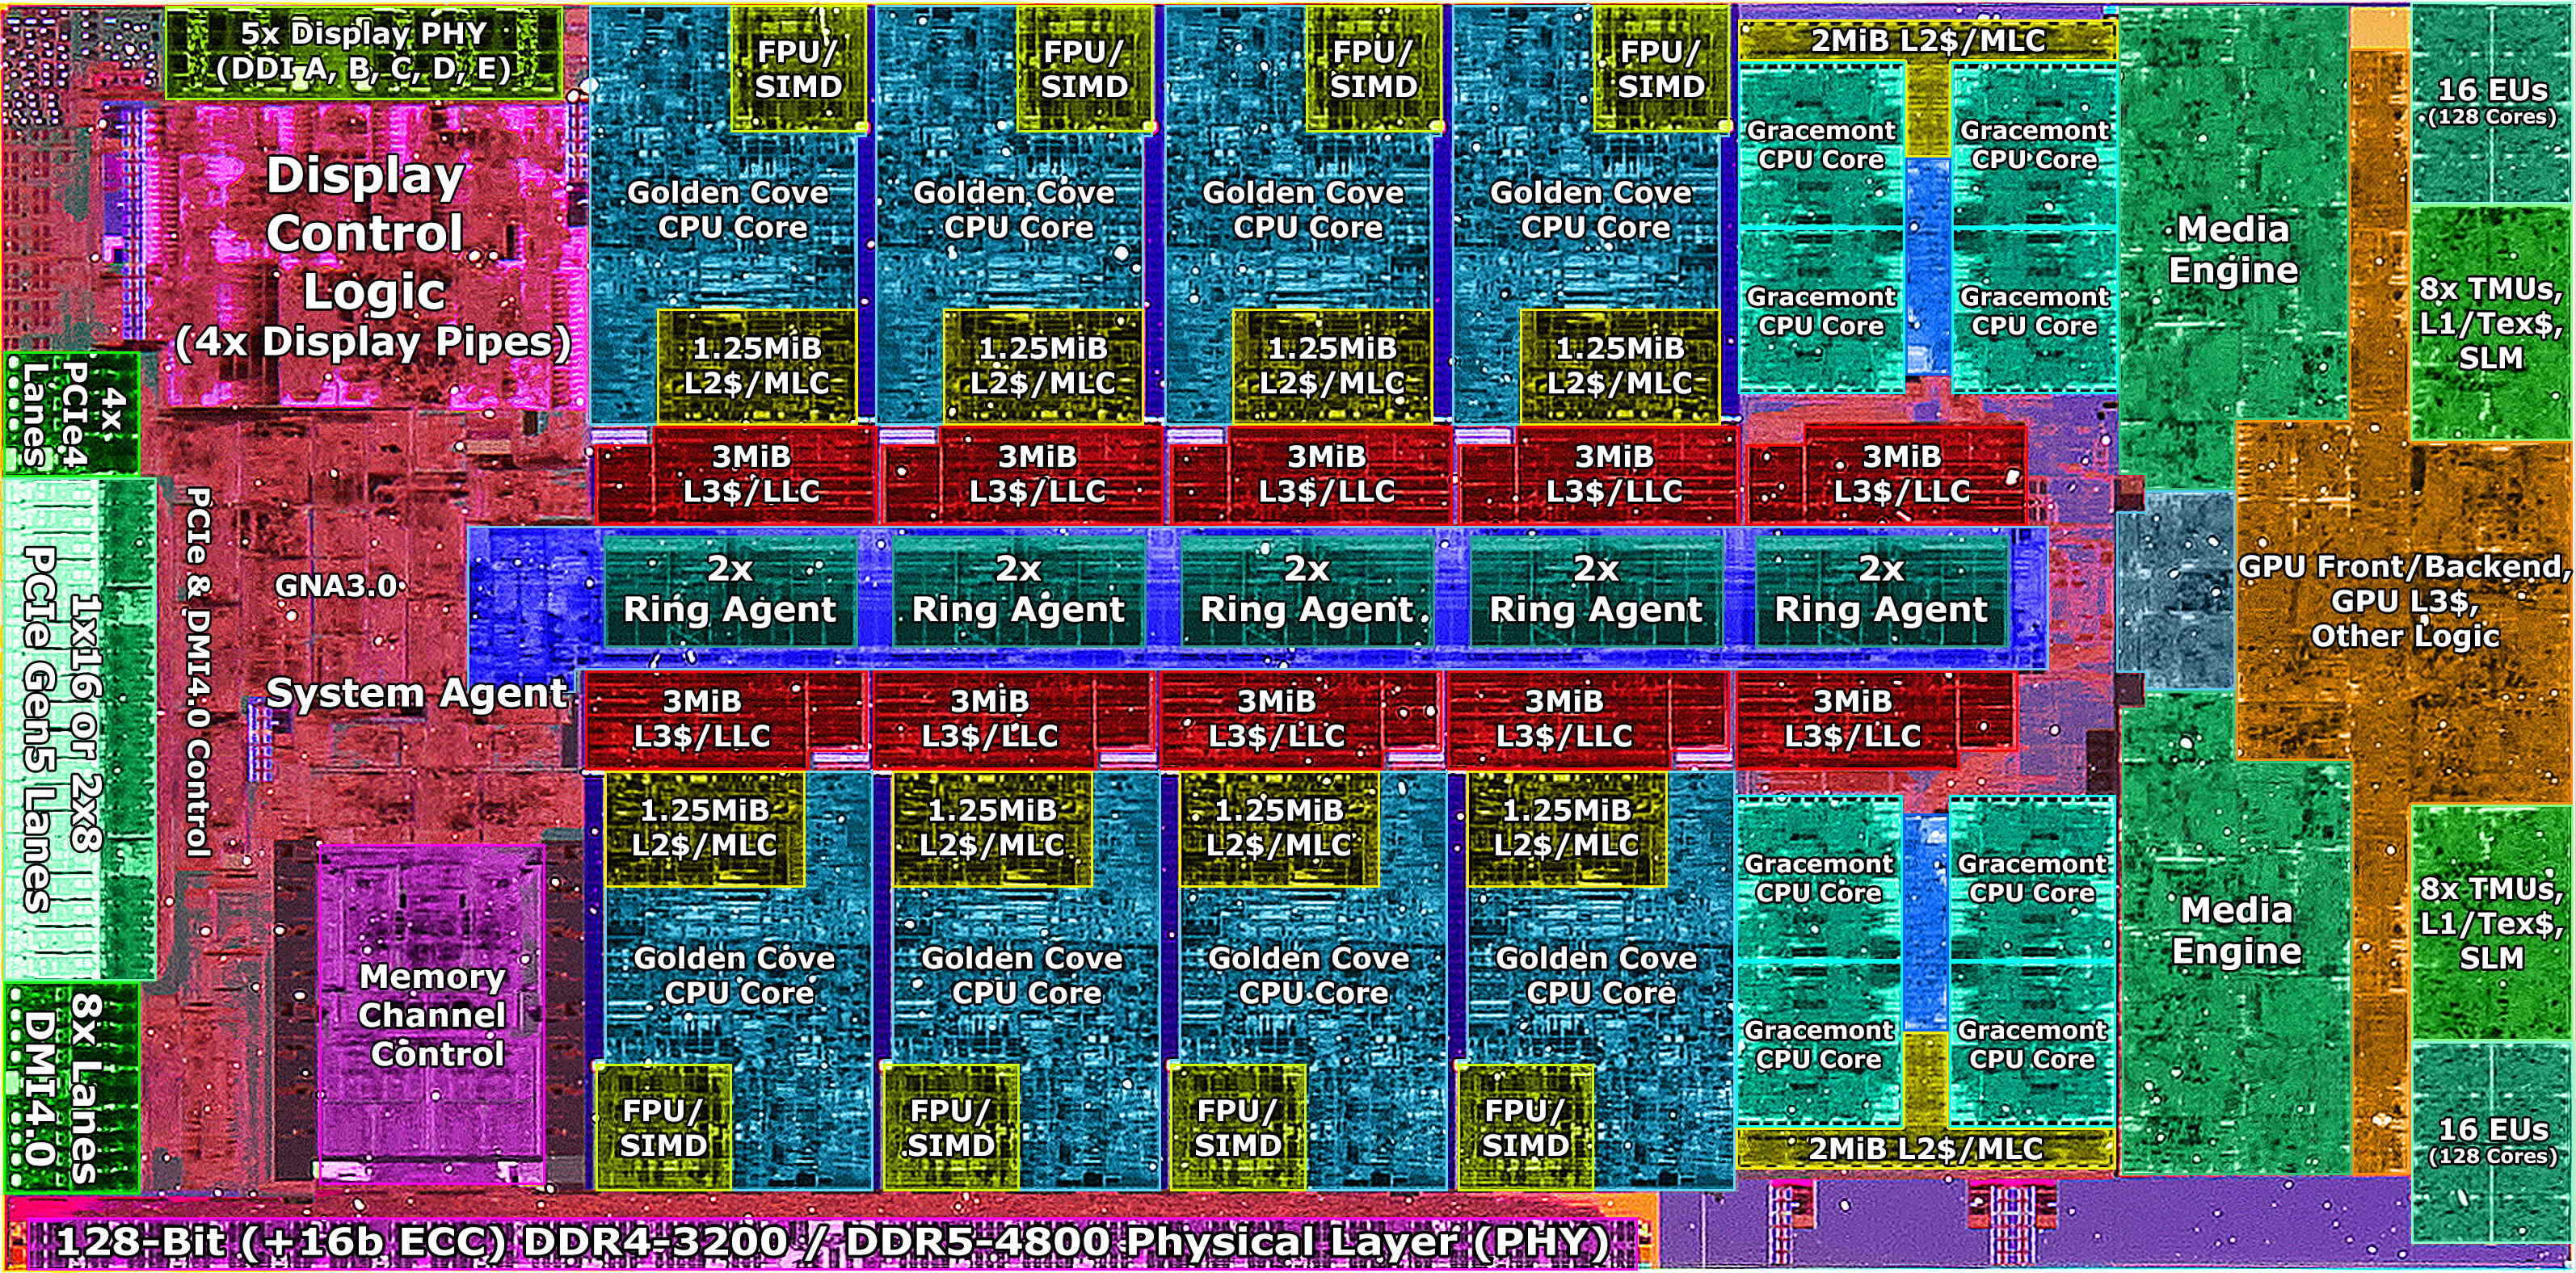
In order to measure core-to-core latency, we should also learn how the cache coherence works on Intel. I am currently experimenting with microbenchmarks on Skylake microarchitecture. Due to the scalability issues with ring interconnect on CPU dies in previous models, Intel opted for 2D mesh interconnect microarchitecture in recent years. In this microarchitecture, CPU die is split into tiles each accommodating cores, caches, CHA, snoop filter etc. I want to emphasize the role of CHA here. Each CHA is responsible for managing coherence of a portion of the addresses. If a core tries to fetch a variable that is not in its L1D or L2 cache, the CHA managing the coherence of the address of the variable being fetched will be queried to learn whereabouts of the variable. If the data is on the die, the core currently owning the variable will be told to forward that variable to the requesting core. So, even though the cores that communicate with each other are physically contiguous, the location of the CHA that manages the coherence of the variable they will pass back and forth also is important due to cache coherence mechanism.
Related links:
  CPU   0    1    2    3    4    5    6    7    8    9   10   11   12   13   14   15   16   17   18   19
   0    0   12   60   44   60   44   60   43   50   47   56   48   58   49   60   50   79   79   78   79
   1   12    0   45   45   44   44   60   43   51   49   55   47   57   49   56   51   76   76   76   76
   2   60   45    0   13   42   43   53   43   48   37   52   41   53   42   53   42   72   72   72   72
   3   44   45   13    0   42   43   53   42   47   37   51   40   53   41   53   42   72   72   72   72
   4   60   44   42   42    0   13   56   43   49   52   54   41   56   42   42   41   75   75   74   75
   5   44   44   43   43   13    0   56   43   51   54   55   41   56   42   56   42   77   77   77   77
   6   60   60   53   53   56   56    0   13   49   54   56   41   57   42   57   42   78   78   78   78
   7   43   43   43   42   43   43   13    0   46   47   54   41   41   41   55   41   72   71   71   71
   8   50   51   48   47   49   51   49   46    0   12   51   51   54   56   55   56   75   75   75   75
   9   47   49   37   37   52   54   54   47   12    0   49   53   54   56   55   54   74   69   67   68
  10   56   55   52   51   54   55   56   54   51   49    0   13   53   58   56   59   75   75   76   75
  11   48   47   41   40   41   41   41   41   51   53   13    0   51   52   55   59   75   75   75   75
  12   58   57   53   53   56   56   57   41   54   54   53   51    0   13   55   60   77   77   77   77
  13   49   49   42   41   42   42   42   41   56   56   58   52   13    0   55   54   77   77   77   77
  14   60   56   53   53   42   56   57   55   55   55   56   55   55   55    0   12   74   70   78   78
  15   50   51   42   42   41   42   42   41   56   54   59   59   60   54   12    0   75   74   74   77
  16   79   76   72   72   75   77   78   72   75   74   75   75   77   77   74   75    0   55   55   55
  17   79   76   72   72   75   77   78   71   75   69   75   75   77   77   70   74   55    0   55   55
  18   78   76   72   72   74   77   78   71   75   67   76   75   77   77   78   74   55   55    0   55
19 79 76 72 72 75 77 78 71 75 68 75 75 77 77 78 77 55 55 55 0Erm, I guess I should try.
         0       1
    0
    1   26±0
    2   26±0    17±0
    3   27±0    17±0
    4   32±0    17±0
    5   29±0    19±0
    6   32±0    18±0
    7   31±0    17±0
    8  138±1    81±0
    9  138±1    83±0
   10  139±1    80±0
   11  136±1    84±0
   12  134±1    83±0
   13  137±1    80±0
   14  136±1    84±0
   15  139±1    84±0
   16   16±0    16±0
   17   28±0     8±0
   18   33±0    17±0
   19   29±0    16±0
   20   28±0    17±0
   21   29±0    19±0
   22   32±0    18±0
   23   31±0    17±0
   24  137±1    81±0
   25  140±1    79±0
   26  143±1    80±0
   27  138±1    82±0
   28  139±1    82±0
   29  139±1    81±0
   30  142±1    82±0
31 142±1 84±0 CPU 0 1 2 3
0 0 77 77 77
1 77 0 77 77
2 77 77 0 77
3 77 77 77 0
  CPU    0    1    2    3
    0    0   71   71   71
    1   71    0   71   71
    2   71   71    0   71
3 71 71 71 0A request to the community - I am particularly interested in the Apple M1 Ultra. Apple made a pretty big fuss about the transparency of their die-to-die interconnect in the M1 Ultra. So, it would be very interesting to see what happens with it - both on Mac OS and (say, Asahi) Linux.
This paper describes a mechanism for client threads pinned to a distinct cores to delegate a function call to distinguished server thread pinned to its own core all on the same socket.
This has a multitude of applications the most obvious one making a shared data structure MT safe through delegation rather than saddling it with mutexes or other synchronization points especially beneficial with small critical sections.
The paper's abstract concludes claiming "100% [improvement] over the next best solution tested (RCL), and multiple micro-benchmarks show improvements in the 5–10× range."
The code does delegation without CAS, locks, or atomics.
The efficacy of such a scheme rests on two facets, which the paper explains:
* Modern CPUs can move GBs/second between core L2/LLC caches
* The synchronization between requesting clients and responding servers depends on each side spinning on shared memory address looking for bit toggles. Briefly, servers only read client request memory which the client only writes. (Clients each have their own slot). And on the response side client's read the servers shared response memory, which only the server writes. This one-side read, one-side write is supposed to minimize the number of cache invalidations and MESI syncs.
I spent some time testing the author's code and went so far as writing my own version. I was never able to make it work with anywhere near the throughput claimed in the paper. There's also some funny "nop" assembler instructions within the code that I gather is a cheap form of thread yielding.
In fact this relatively simple SPCP MT ring buffer which has but a fraction of the code:
https://rigtorp.se/ringbuffer/
did far, far better.
In my experiments then CPU spun too quickly so that core-to-core bandwidth was quickly squandered before the server could signal response or the client could signal request. I wonder if adding select atomic reads as with the SPSC ring might help.