In this area we have indigenous families that have histories that go back for many hundreds and even thousands of years. I live in an area that had been idyllic for as long as any family can remember, a claim backed by geo/biological evidence. There is no record of the area climate behaving like this. The change has been abrupt and extreme and, frankly, dangerous.
Wait, wood-burning fireplaces are gross? Do you mean aesthetically or conceptually?
I doubt too many in Florida depend on them for heat like they might have in past decades, but can't fireplaces still be enjoyed for what they are? Cozy to sit near, fun to watch/cook over, great for incinerating incriminating documents, etc. As long as the nights/winters get cool enough they're still nice for some things.
We used to have a light dusting of snow on Halloween every year like clockwork. It sucked but it's long gone and now Halloween reminds me every year of how the world has changed.
The wind is new. The mornings where every lawn is covered in branches. That never happened when I was a kid. And the sudden torrential tropical-storm like downpours that vanish as quickly as they come. This has real impact on our electrical system -- the power's been out for over a week for folks in Ottawa.
Anthropologists and biologists commonly track changes in floral/faunal ranges and ecosystems by asking the people who observe them daily.
Where is that? Thousands of years is well beyond the histories of any North American tribes.
> Traditional knowledge that relates to prehistoric eruptions is part of the oral history of many Native American tribes. This knowledge even extends back to volcanic activity that occurred thousands of years in the past.
> Oral traditions of the Klamath tribes and Umpqua people indicate that people witnessed the eruption of Mount Mazama 7,700 years ago. Artifacts have also been found underneath the Mazama ash layer.
"Climate"
"Not Found"
To be very clear before the knee jerk downvoting occurs, climate change is very real and needs to be addressed, scientifically. Don't bail on the mountains of science to make points in a small article about a regional high over a limited time.
Turns out, yeah, it is climate change. The whole distribution is shifting over.
This article isn't about temperatures distributed over time or the globe. It's about one state over one month. That is cherry picking data and doesn't support global warming any more than one place is cold disproves it.
I'm saying to take global warming out of the popularity/anecdote contest, even when popularity and single points of data support it. But I see that people would rather play the popularity game by down voting me. They would also prefer to cherry pick data. Both of these backfire when someone else has enough votes or gets to pick the data.
Nothing I've written has been against climate change. It's merely against the, "See it's hot! Climate Change!" style argument which I believe does more harm than good.
https://en.wikipedia.org/wiki/U.S._state_and_territory_tempe...
Notice the dates:
     < 1920: 6
  1920-1940: 26
  1940-1960: 4
  1960-1980: 3
  1980-2000: 11
  2000-2022: 6
Now let's look at record low temperatures:
  1885-1900: 6
  1900-1920: 8
  1920-1940: 9
  1940-1960: 7
  1960-1980: 9
  1980-2000: 13
  2000-2022: 4
What, if any, conclusion can be drawn from these data? Just going by the numbers the 1920-1940 interval was the hottest on record thus far but in the same period a relatively high number of record cold temperatures were recorded. The same is true for the 1980-2000 interval. The conditions which give rise to record high temperatures also seem to be capable of producing record low temperatures. Elsewhere in this thread I posted an observation on the close relation between insolation and average temperature [1]. The difference in insolation is most likely related to the amount of aerosol pollution (of natural and human origin) in the atmosphere given that an increase in aerosol pollution leads to an increase in cloud cover due to those aerosols functioning as cloud condensation nuclei. It would be interesting to see the data on insolation/SSR (solar surface radiation) for these regions and compare it to those record periods. I would expect to find a correspondence there which would explain both the high as well as the low temperature records - clear skies make for hot summer days and cold winter nights.
The thing that's emblematic of climate change is not any one extreme — not that it's A's hottest X, B's coldest Y, C's wettest Z — but rather that it's all of these extremes simultaneously, and that they're all more extreme than they were in the past. At the same time that A is having its hottest X, B is having its coldest Y, and C is having its wettest Z, and it's a heat record for A, a cold record for B, and a wetness record for C. Simultaneously breaking weather records in multiple places, regardless of which exact records are being broken, is a prediction and sign of climate change.
It's not just about heat!
Also, for anyone who's not familiar with Sinclair, they're essentially the Fox News of local news broadcasts. https://www.vox.com/2018/4/3/17180020/sinclair-broadcast-gro...
(in case someone missed this, it's incredible: https://www.youtube.com/watch?v=ZggCipbiHwE)
What the article says is the average high/low of the first 11 days is hotter than the hottest month.
Uhhh… statistics don’t work like that?
You cant compare a part month to a full month and make that claim because your selectively comparing some days to an average of a whole month.
And short term weather forecasting is common technology.
And it goes on to say "Unfortunately, our lead will only increase with the third week of May likely to shatter numerous records across the state of Texas. "
Anyway, those 10 days were hotter than any other first 10 days of May:
https://www.lcra.org/first-ten-days-of-may-among-the-hottest...
Since 70's average mean global temp went steadily by 1C in almost straight line.
Anything else is just click-bait articles that don't change underlying data.
- It's always being added to (parent comment) - It's nothing but a fable agreed upon - Napoleon - It repeats itself - It's written by the victors - Churchill - It's only remembered by the vanquished - We are not makers of history, we are make of history - MLK Jr
And my personal favorite found when researching for this comment:
"The very ink with which history is written is merely fluid prejudice." - Mark Twain
Reference: https://www.thoughtco.com/famous-history-quotes-2832302
Title should be “since 1925.”
In the chart near the top it shows 1902 having the 4th hottest may.
My garden is doing great thanks to the cool, gentle spring (and some good fortune that the seeds I planted happen to prefer this weather). After last summer I’m actually enjoying this shift a lot.
Also April 2022 was in Prague 123rd warmest among last 248 years, in light of nonsense how hot are supposed to be recent years, this feels extremely cold to be getting median temperature from last qurater millennium. Btw. the hottest April was in 1800, coldest in 1839, so much for records.
https://www.irozhlas.cz/zpravy-domov/duben-praha-klementinum...
I live in a place (Seattle) where the special thing about the weather is that it’s temperate and fairly predictable (our version of timeframe in your paraphrase is 5 minutes, otherwise it’s fluctuations within a stable range). Well, it used to be anyway.
Two data points doesn’t make a trend, three might suggest keeping an eye on it. Five years running with consistently uncommon heat and humidity and prolonged fire seasons isn’t a weather variable, it’s a change in climate.
Again, Seattle has been relatively stable. Relative to global temperatures, we’ve lagged behind the trend. World records have been concentrated in recent years in a way that’s only deniable if your probability models scale to centuries. Local records in other places make that completely untenable as a hypothesis, with some places breaking whatever pertinent record pretty much constantly for several years longer.
Weather does change, it’s the nature of living on a spheroid spinning around on a tilted axis with most of its energy coming from a nearby star. Many trips around that star showing similar persisting changes isn’t weather. It’s climate.
Although after living here long enough, you start to recognize monsoonal microseasons. It's still ~30 deg C all year around, but the average is a couple of degrees cooler in 'winter', especially after a couple of days of solid rain, and a couple of degrees hotter in 'summer', especially after a dry spell.
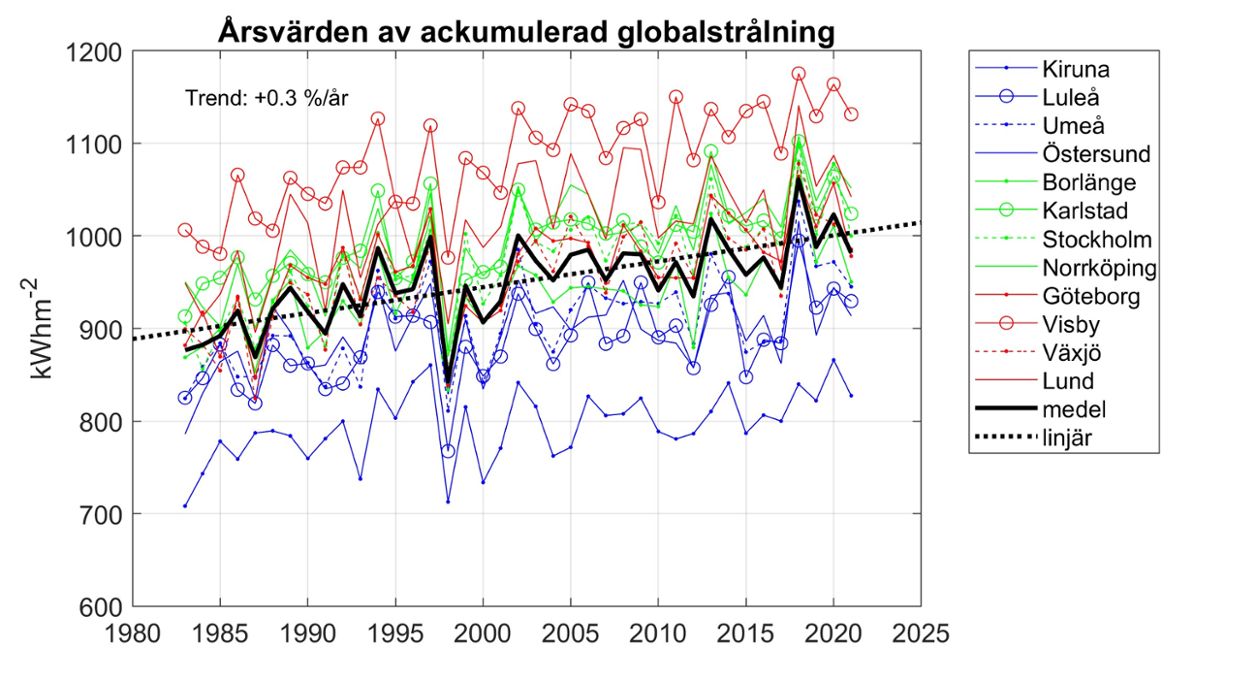
https://www.smhi.se/polopoly_fs/1.181504.1647960904!/image/a...
Notice the steady increase (called "global brightening"). This graph is produced and hosted by the Swedish Meteorological & Hydrological Institute (SMHI). They don't produce similar graphs for longer periods nor do they show the correspondence between average insolation and temperature. Fortunately the data is available for Stockholm (see e.g. page 184 of IPCC's AR5 - Observations: Atmosphere and Surface, [1]) which made it possible to create such a graph:
The correspondence between insolation and average temperature is very strong but it hardly ever gets mentioned in the public discourse around climate change. It is discussed on page 186 of AR5 chapter 2 [1] where the observation is made that there is a correspondence and there are numerous studies which come to the same conclusion but as so often is the case there is little to no relation between what the scientific literature says and how the media presents this.
[1] https://archive.ipcc.ch/pdf/assessment-report/ar5/wg1/WG1AR5...
Much extreme seesawing of temperature too.
> Our hottest May in history gets much worse next week
> What we have seen so far in the month of May is nothing short of extraordinary. When you take the average temperature (morning lows & afternoon highs) in Austin through the first 11 days of the month, you get 82.2 degrees. That is 1.6 degrees higher than the next hottest May on the list, 2018. I know that doesn't sound like much, but that is a significant margin when looking at multi-day averages. Unfortunately, our lead will only increase with the third week of May likely to shatter numerous records across the state of Texas.
> May 2022 is our hottest May in history through the first 11 days.
> First, WHY have we been so hot so early in the year? It has been the perfect storm of ingredients including a La Nina phase of the El Nino Southern Oscillation, our worst drought in seven years, and finally a very early showing of a ridge of high pressure that has been stubborn over the southern U.S. High pressure consists of sinking air in the lower and middle levels of the atmosphere, and physics dictates that when air sinks, it compresses, and compressed air is hotter.
> Now, onto the forecast for the next 7 to 10 days in Texas. The ridge of high pressure is in the process of reorganizing and intensifying over Mexico, and it will return to Texas as early as this weekend. It won't be in a hurry to leave either with this sinking air situated over the state through all of next week.
> In Austin, that gets us to the upper 90s as early as Saturday and near/above 100 by Sunday and Monday. Hitting 100 this early in the year is highly unusual with this marking our third earliest trip to triple digits in Austin's recorded history. We could push even higher though through the second half of next week.
[Edit - continuing after it finished resulted in a blank page. Refreshing the page resulted in "403 Forbidden". Clearly they just do not want you to disable the optional cookies. It is Sinclair after all, so I'm surprised I didn't have to provide voter registration info to get in.]
" We are processing the requested change to your cookie preferences.
This may take up to a few minutes to process. Processing 67%
Some opt-outs may fail due to your browsers cookies settings. If you would like to set opt-out preferences using this tool you must allow third party cookies in your browser settings.
Powered by: Company logo for TrustArc "