Here in Canada we've been told suicides have gone down during the pandemic.
Surely the best way to examine the true impact of COVID is to understand the raw death figures, particularly if there were factors such as weak 2019 flu seasons/deaths which may have contributed to mortality displacement?
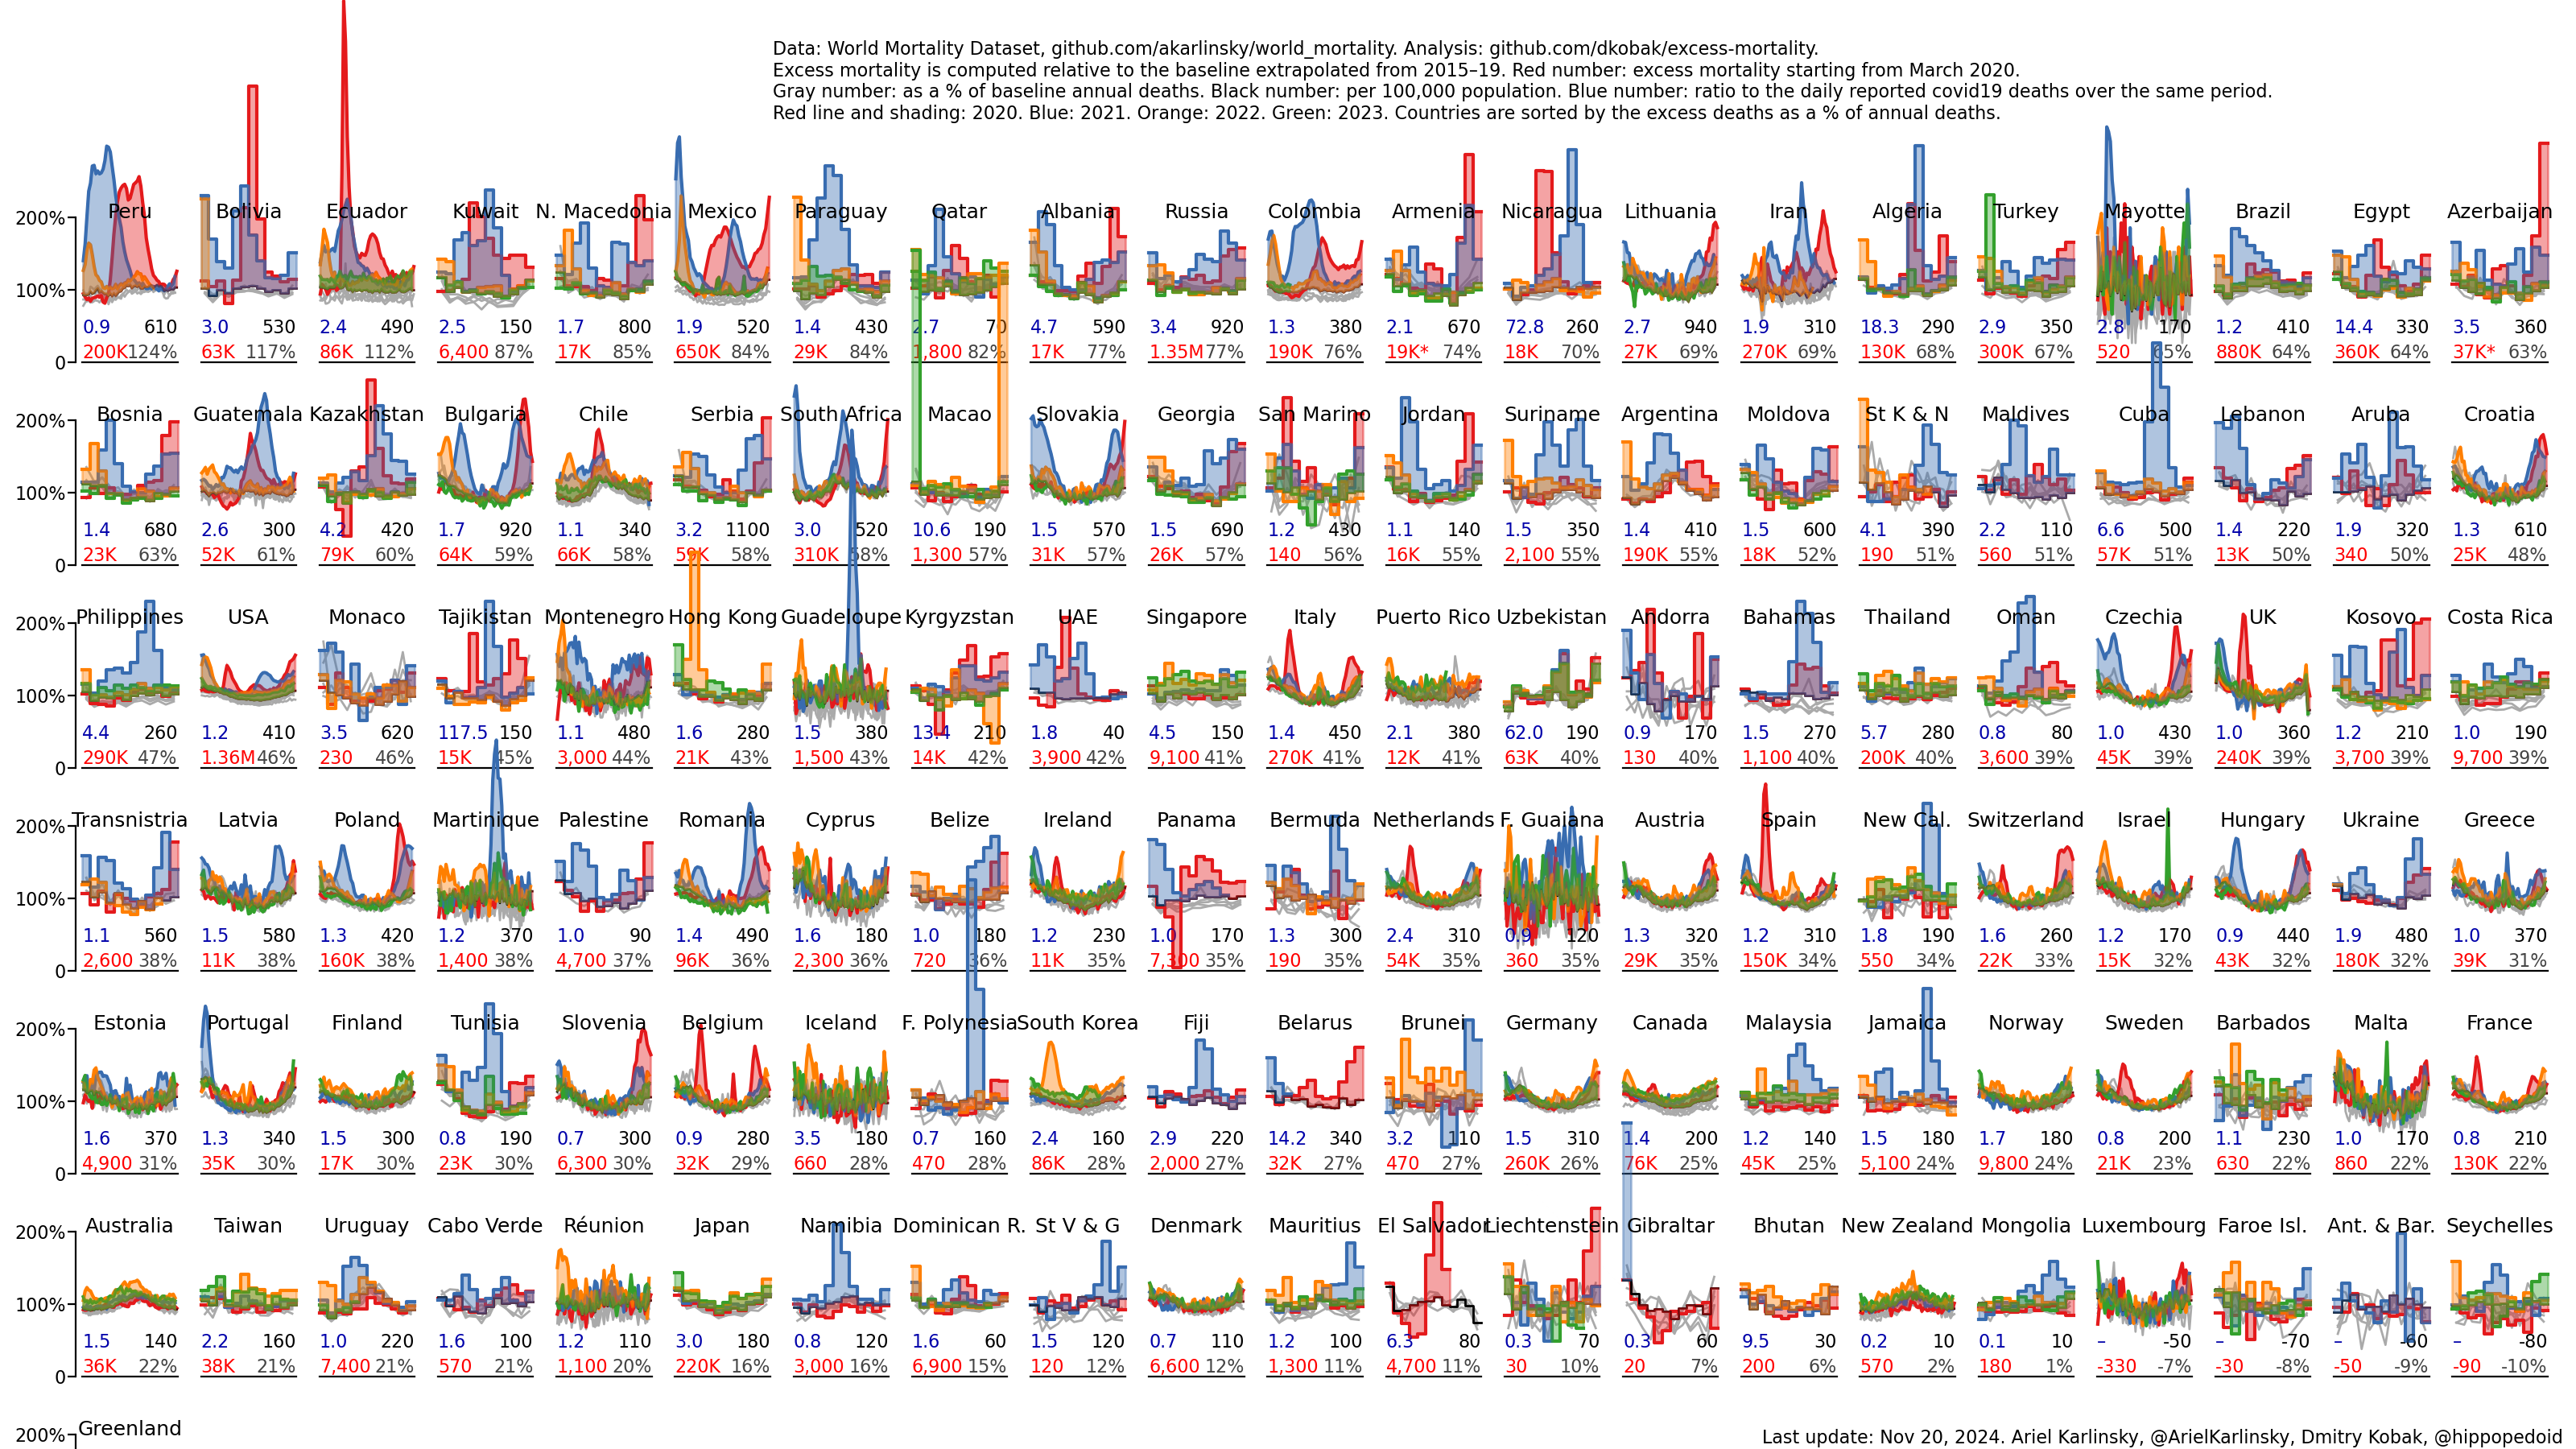
https://dennikn.sk/2304197/prehliadli-sme-mozno-az-styritisi... - the grey dotted dash line is the extreme values for the last 2 decades, red line is the current deaths, black dotted dash line is the threshold of standard deviation.
The most extreme value in the last 2 decades was 1411 deaths per week, last week of 2020 had 2059 deaths per week.
We need the raw annual data which basically removes this noise.
My wife was first ill with covid this time last year, and is still suffering now. She didn't get covid that bad, wasn't hospitalised, and prior to falling ill was working out 4 days a week and a damn busy person.
Now a 15 min walk can see her needing to sleep it off for 2 hours.
We are very lucky that she wasn't working before this, as there is no way she could have worked this last year. She knows of many others who have lost jobs, houses and even partners due to the impact of their long covid.
So I'm always a little touchy when people act as though deaths is the only factor to record.
Is it though? As an example motor vehicle fatalities went up sharply in 2020. Is this due to the pandemic?
If anything the pandemic should have decreased car accidents, because miles driven went down. It seems there’s possibly an orthogonal force at work. Possibly the rising market share of monster pickup trucks, which are particularly deadly to pedestrians.
My point is the pandemic was obviously the biggest change that happened in 2020, but it wasn’t the only change.
>If anything the pandemic should have decreased car accidents, because miles driven went down. It seems there’s possibly an orthogonal force at work. Possibly the rising market share of monster pickup trucks, which are particularly deadly to pedestrians.
>If anything the pandemic should have decreased car accidents, because miles driven went down. It seems there’s possibly an orthogonal force at work. Possibly the rising market share of monster pickup trucks, which are particularly deadly to pedestrians.
Nice theory but I think it's far more likely that the pandemic completely upended "regular traffic" everywhere causing millions of people to be driving/walking at days/times/places and in traffic conditions that they were not accustomed to and this was a fairly instant change so pretty much everyone was flying by the seat of their pants. Predictable traffic is safe traffic and the pandemic changed normal traffic patterns in pretty much the entire western world creating tons more opportunities for mismatched expectations of behavior between traffic participants.
So perhaps more risky driving occurs when fewer other cars are around? Maybe the risk-averse stay home, leaving only riskier people to go out? Clearly, the pandemic had an indirect effect here though.
One interesting observation is that the extra deaths during the pandemic are only a third of the deaths attributed to covid. That implies that two thirds of the covid deaths would have been expected anyway last year without covid?
Surely just looking at the past 5 years is not enough.
Wouldn't you at least have to take into account generations? (ageing populations) (So maybe 60 years of data?)
The linked graphs could easily just represent an older generation dying off. (Even the humps could just be regular flu seasons for an ageing population)
Then you have to choose a range for your generation 50-80 year olds etc
If Covid kills a large proportion over 80, and your range for generations is 50-79, the data would be completely off yet again.
There must be a lot more facets to take into consideration.
I feel like those graphs quite statistically weak. What am I missing?
It would be nice to put my money where my mouth is and actually just do my own study. But can't think of a country who would have reliable stats going back 60 years on death tallies.
(Semi relevant paper on looking at ageing population stats -> https://www.karger.com/Article/FullText/494025)
The mortality is as bad as in 2005 roughly!
I find the +/- sentiments interesting, it wasn't any intention of mine to approve/disprove anything, I was just sitting at home thinking were the original charts meaningful.
I think you're just missing the definition of "excess death", it's literally how much more deaths were registered against an average of the last years.
It's just a basic indicator that indicates that something has happened and further investigation is required to clarify the reasons.
If the "excess deaths" was raised because the "baby boomers" generation was dying off a further investigation would be required to identify that.
My wording sucks, I don't think my personal judgement of "excess deaths" is "correct", — nothing like that.
It just kind of feels like, as an example, people trying to predict financial markets, throw in a few factors, and a few sentiments and thus, X does equal B^(Y * B)(blah % what)(huh ^ bleh).
The "further investigation" is the "investigation" I was originally begging the question for.
Not trying to antagonize you, I just don't really get why the originally linked article is "True", until further things are investigated.
Science is one phenomena that proves itself, that's great.
Stats seems very malleable, I've met some people who are good at statistics, I've personally visually plotted graphs too, and it all kinda seems bias. (I probably did them wrong)
Can any statisticians chime in? Is this a reasonable dataset?
Hence I turn to excess all cause mortality as my main figure. I personally know 2 people that had their lives shortened by the measures instead of the virus itself, so I take that into account.
The main problem I have with the US data (z-scores) is that they dont include 2018 which had a serious flu going around killing a lot.
The Euromomo data does show that 2018 flu spike of mortality. And that puts things in perspective.
Also note that while your anacdotal evidence is sad, it does not take into account that without those measures they might have been as badly off as well due to even more sick people being around at the same time. People easily blame measures but forget that the alternative might be even worse.
If you look at the global rates of excess deaths:
https://www.ft.com/content/a2901ce8-5eb7-4633-b89c-cbdf5b386... (look under “Death rates”)
It looks like the countries that had early and hard shutdowns (like Denmark and S. Korea), had almost zero excess deaths. Which at least to me seems to indicate that the shutdowns themselves have very low impact.
Regarding the 2018 flu spike, putting things into perspective. I would say yes it does, because it shows how significantly bigger the spike for covid was/is.
That's a rather different narrative than I've heard. I wonder what could explain it? Secondary issues related to but not covid?
Taken as a proportion of total Covid deaths, that is very true.
Given that practically no young people die in developed countries, it doesn't take much to make a big change to the excess mortality figure for that age group.
But my statistics math is on a very basic level...
https://en.wikipedia.org/wiki/File:10_leading_causes_of_deat...